Troubleshooting SQL Server Performance Issues in Production
Last week at work we experienced a major performance hit in one of our (SaaS) applications. We use New Relic’s Application Performance Monitoring (APM) software package which flagged SQL as the culprit.
One of our clients had started a training class with ~30 people…something we should normally never notice. We’ve onboarded tens of thousands of new users without batting an eye. Something was definitely sideways, and it was time to dig into SQL to find out.
Disclaimer: I am not a DBA.
A real DBA would have proper tools, techniques, and procedures to diagnose something like this. I have none of those, but I do have Google, and few scripts I’ve accumulated over the years.
Generally, one of the first things I run is sp_who2 or sometimes sp_who2 'active'. This is going to give you a list of all the currently-running queries. When I run this, I take a mental note of how many records there are. Over time, I’ve come to know that our server usually has 200-400 queries running at any given time. In this case, there were 1,305. That’s a lot of activity.
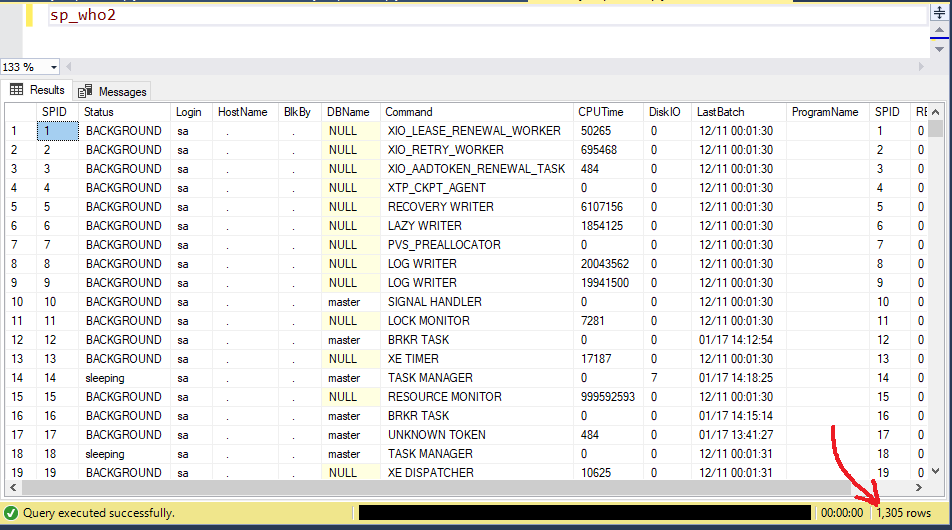
sp_who2 shows currently-running transactions
The first thing I look for are blocked transactions. If a transaction is blocked, it will show up with a SPID# in the “BlkBy” (Blocked By) column. Then you can interrogate the blocking SPID# and see what its doing. One way to do that is with DBCC INPUTBUFFER. Pass in the SPID# and it’ll spit out the query that’s currently running.
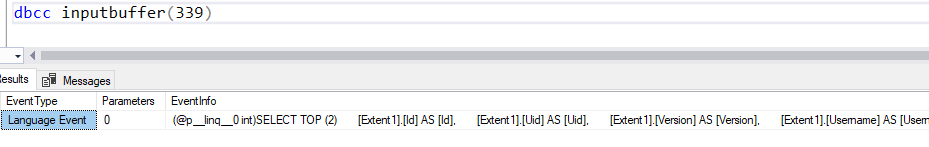
DBCC INPUTBUFFER(n) shows the currently-executing query
Often times, there won’t be any blocked transactions. In that case, the next thing I’ll look at is the query execution plan for currently-running queries. This is by far my favorite tool:
SELECT QP.query_plan as [Query Plan], d.name as database_name, ST.text AS [Query Text] FROM sys.dm_exec_requests AS R CROSS APPLY sys.dm_exec_query_plan(R.plan_handle) AS QP CROSS APPLY sys.dm_exec_sql_text(R.plan_handle) ST inner join sys.databases d on R.database_id = d.database_id order by st.text;
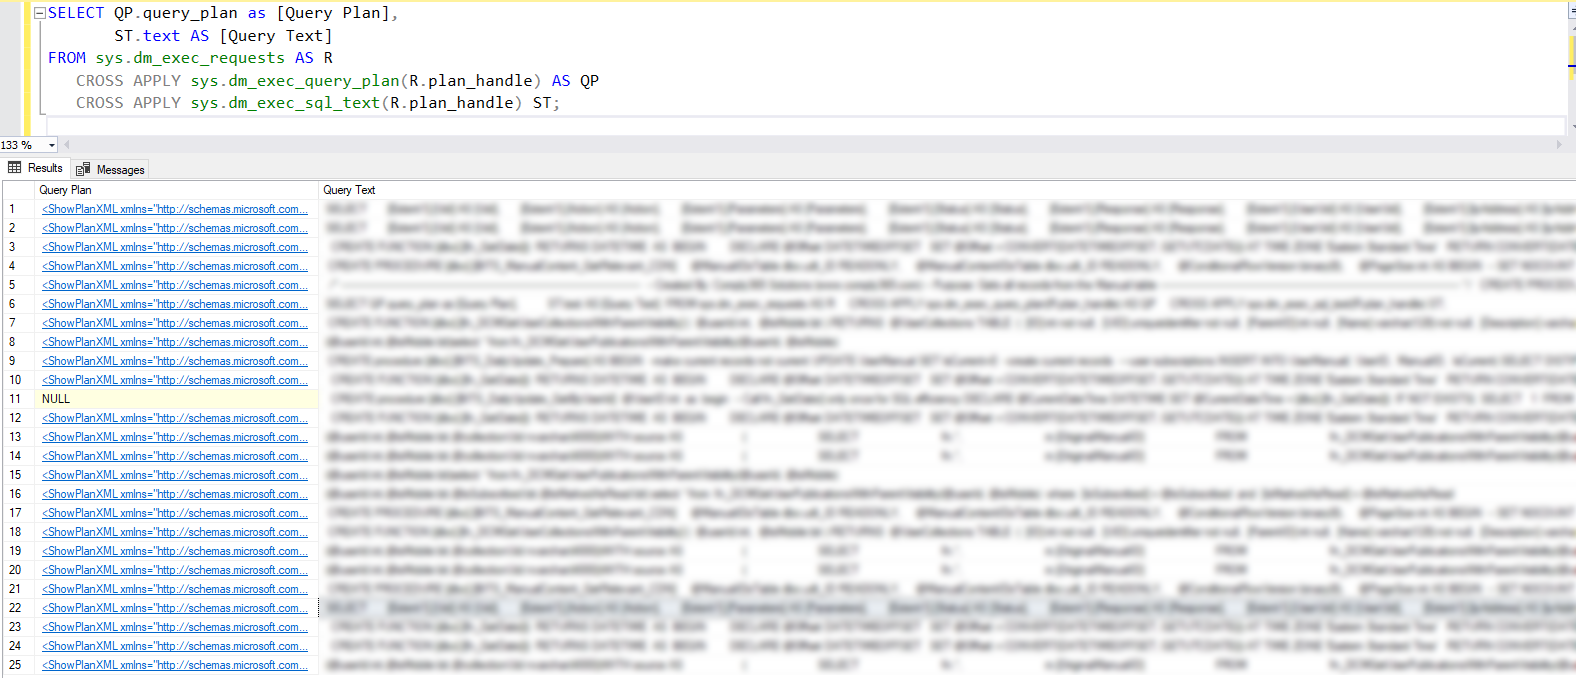
Here we can see the query text along with a link to show the Query Execution Plan
Without APM in place, I wouldn’t know exactly what to look for, but if there were several queries with the same query text - that would indicate
A) a high-traffic web page/query (totally normal activity), or
B) a poor-performing query that’s starting to stack/queue up.
In our case, I knew the web transaction that was experiencing issues and the SQL used in that page, then matched it up with the results in the query text. From there, I clicked on the Query Plan link to investigate.
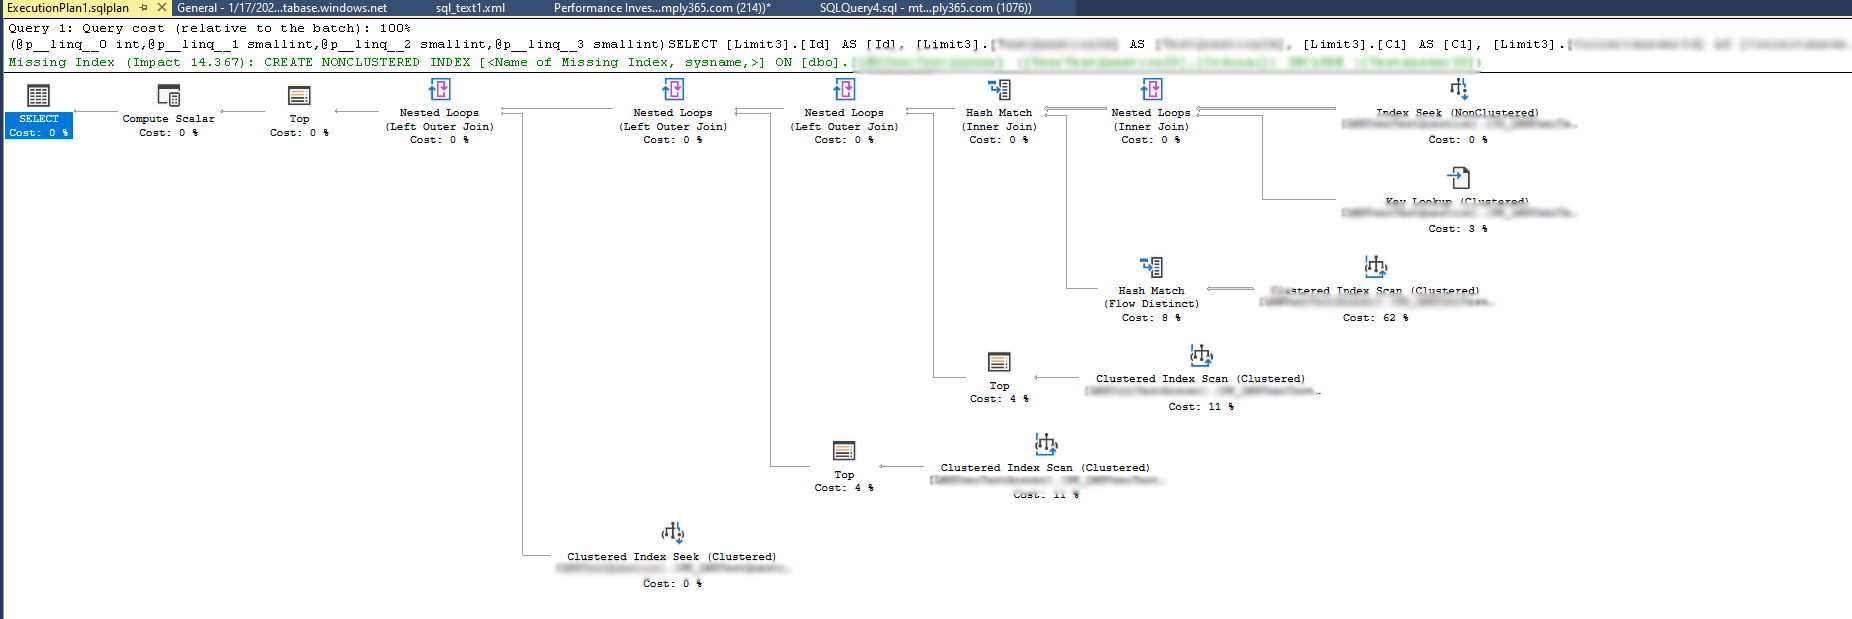
The execution plan recommended I add an index on a table with > 9M records. Sweet deal. Remember, I’m not a DBA, so I just blast this out into production, right? Not so fast. Let’s do a little bit more due diligence.
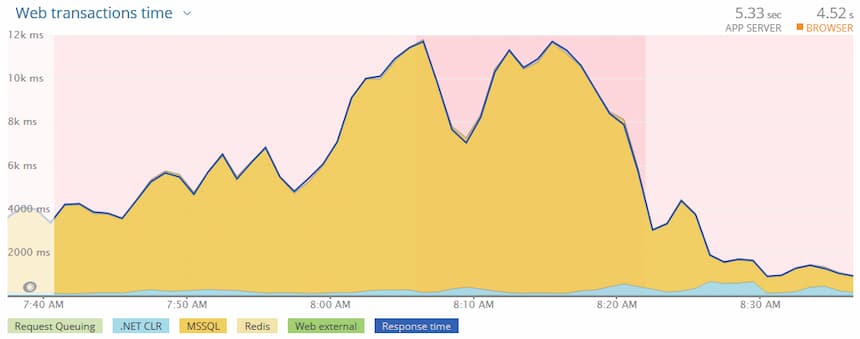
Our systems generally see bell-curve like usage from 10am-3pm. Looking at this CPU graph for the SQL server involved in this issue, we can see extremely high CPU usage in the 7:30am-8:30am range.
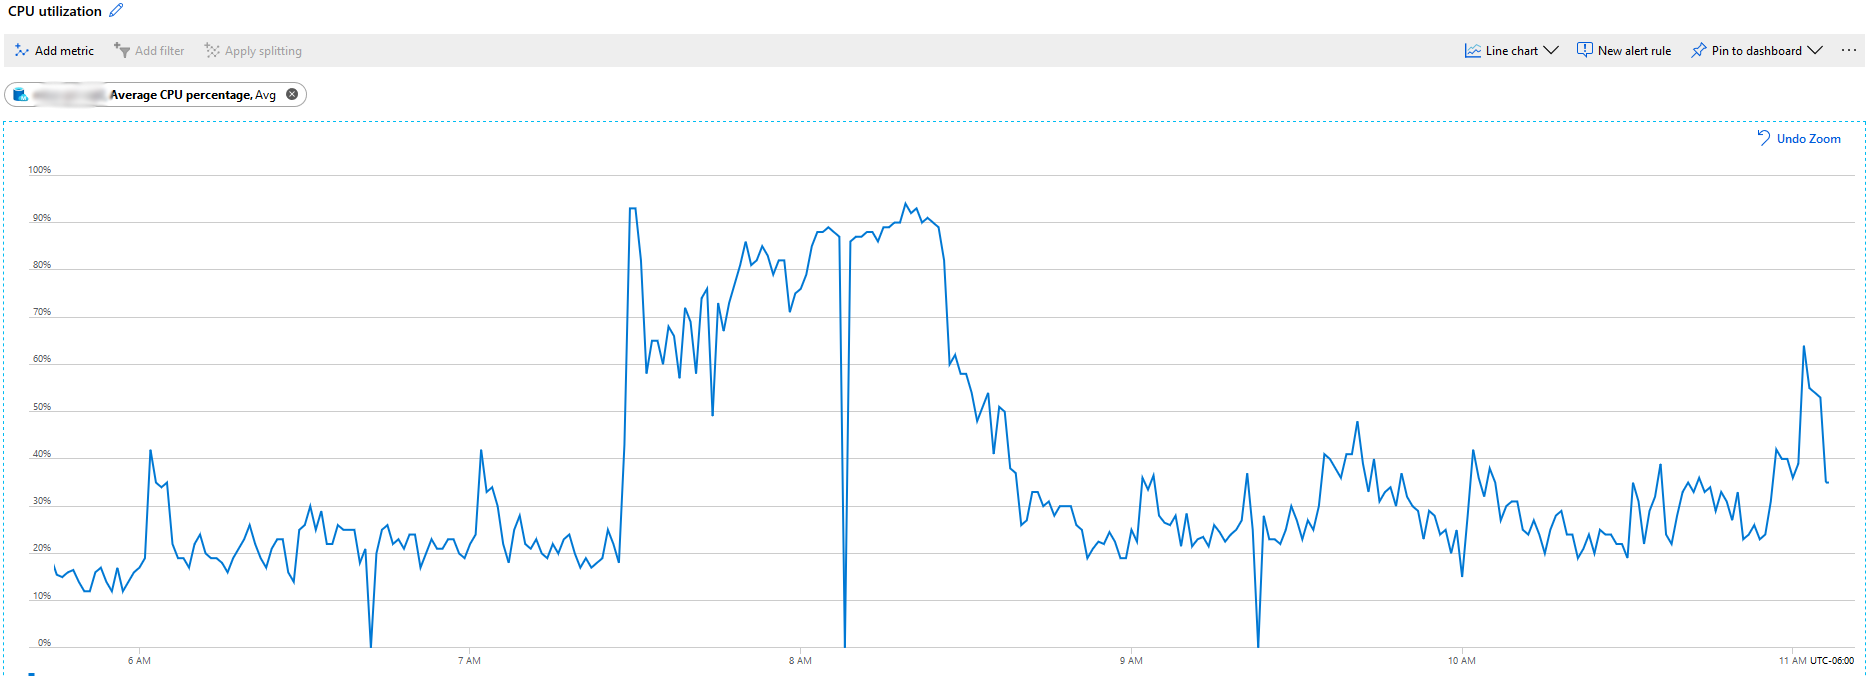
Abnormally high CPU usage.
Let’s go to another favorite of mine, the Performance Dashboard.
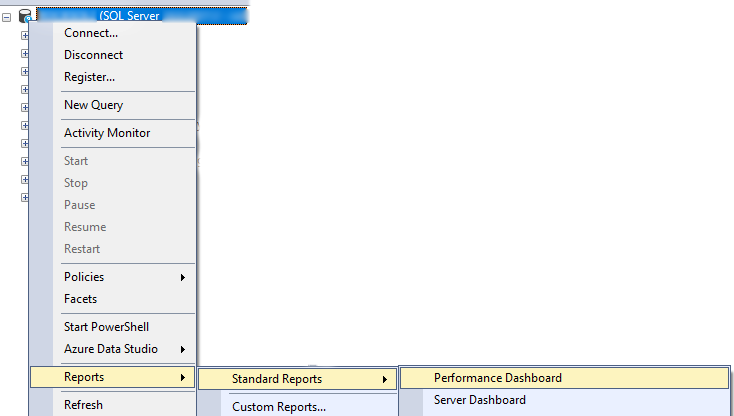
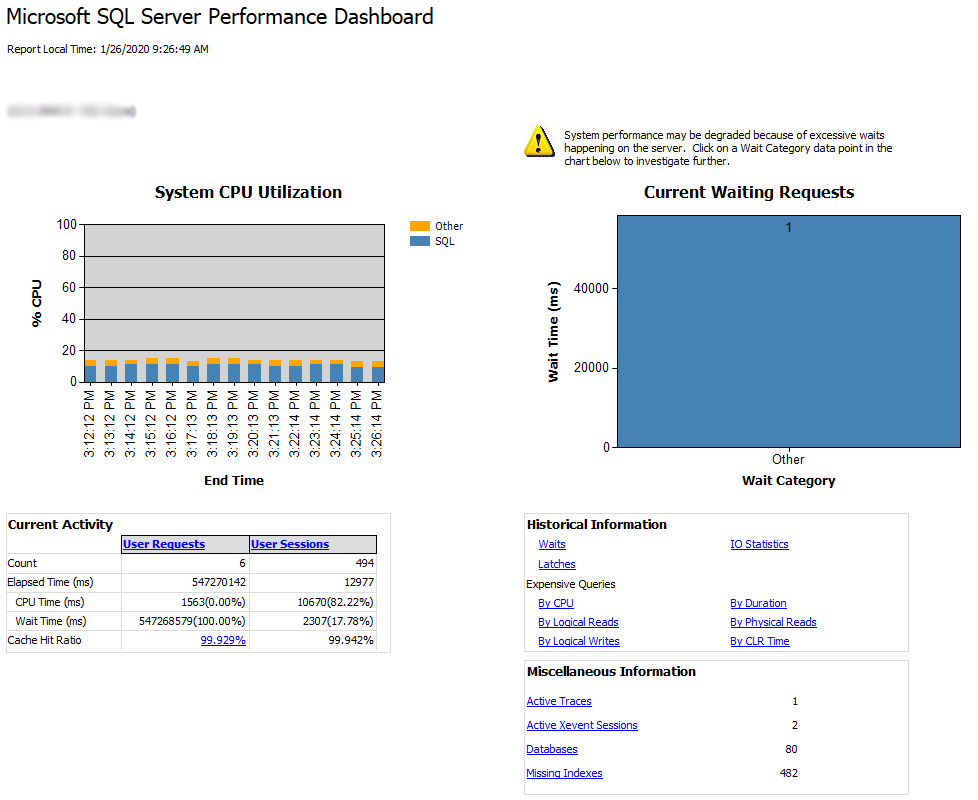
There’s a lot of gold in this data. If you’ve never checked this out, put on your spelunking hat and go exploring!
Knowing I had a high-CPU condition, I took a look at the Expensive Queries “By CPU” report.
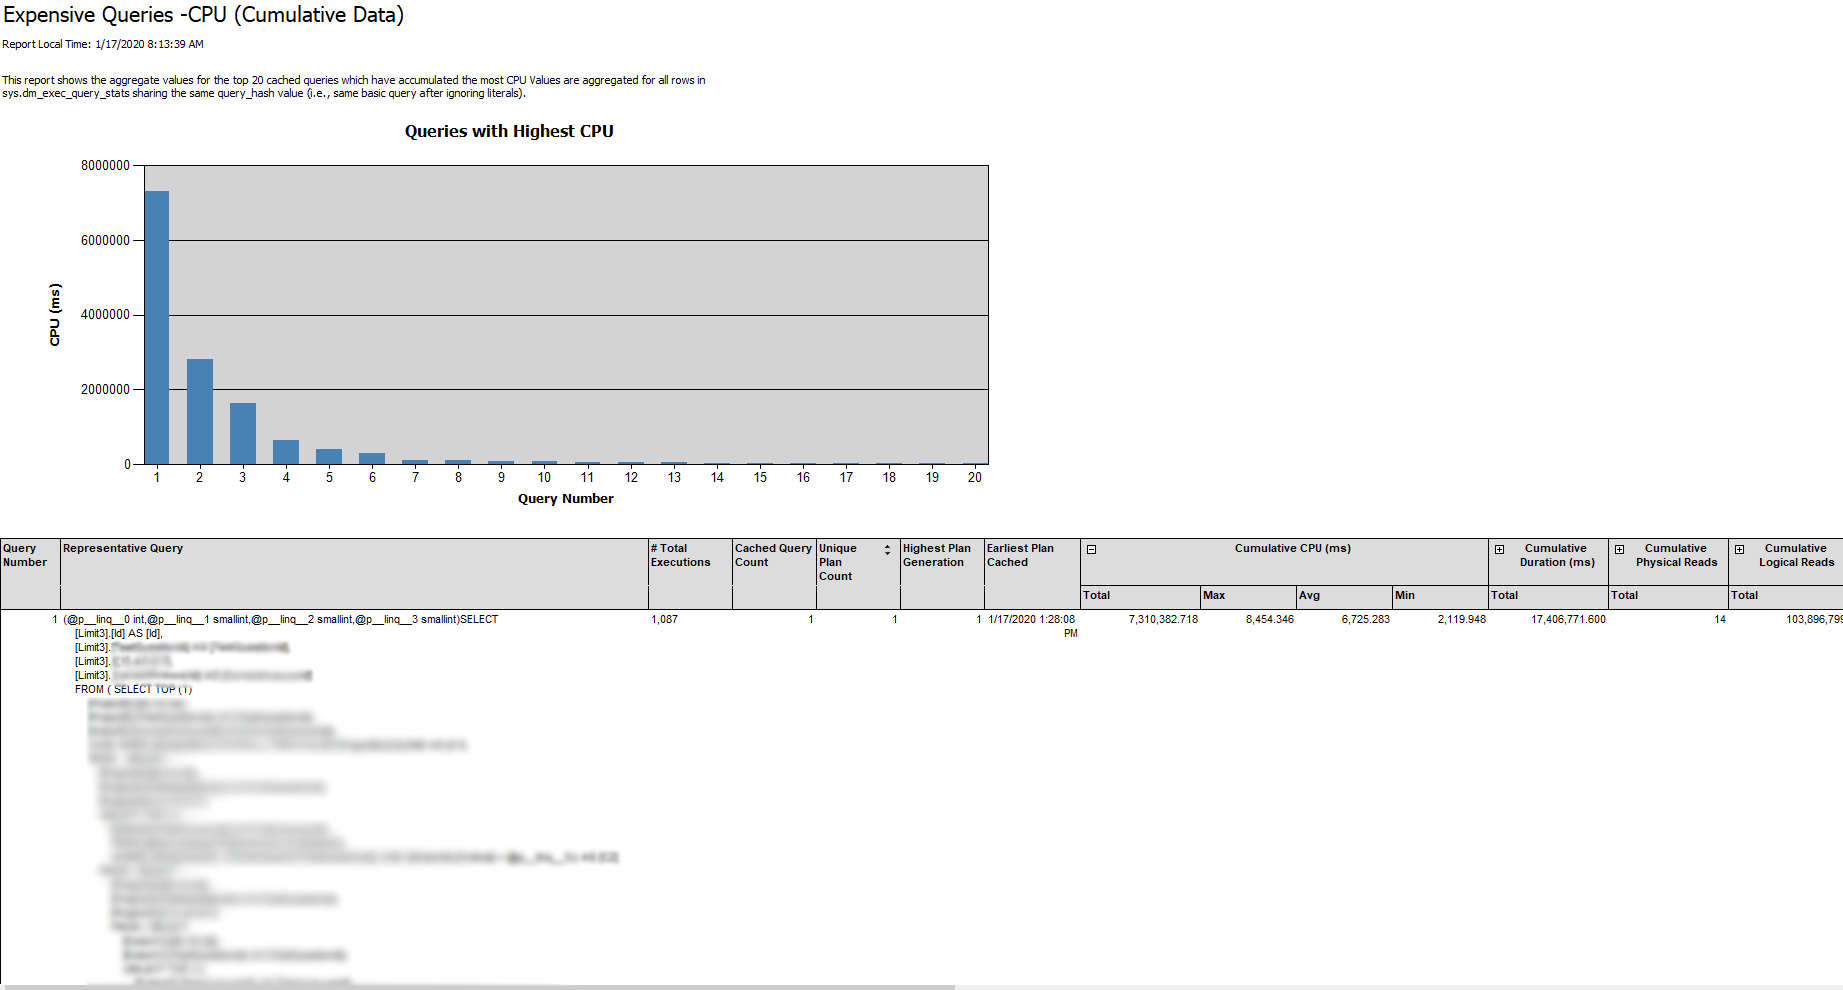
Surprise, surprise, the #1 offending query is the same one that I had looked at earlier. At this point I decided to add the index & see what impact, if any, it’d have.
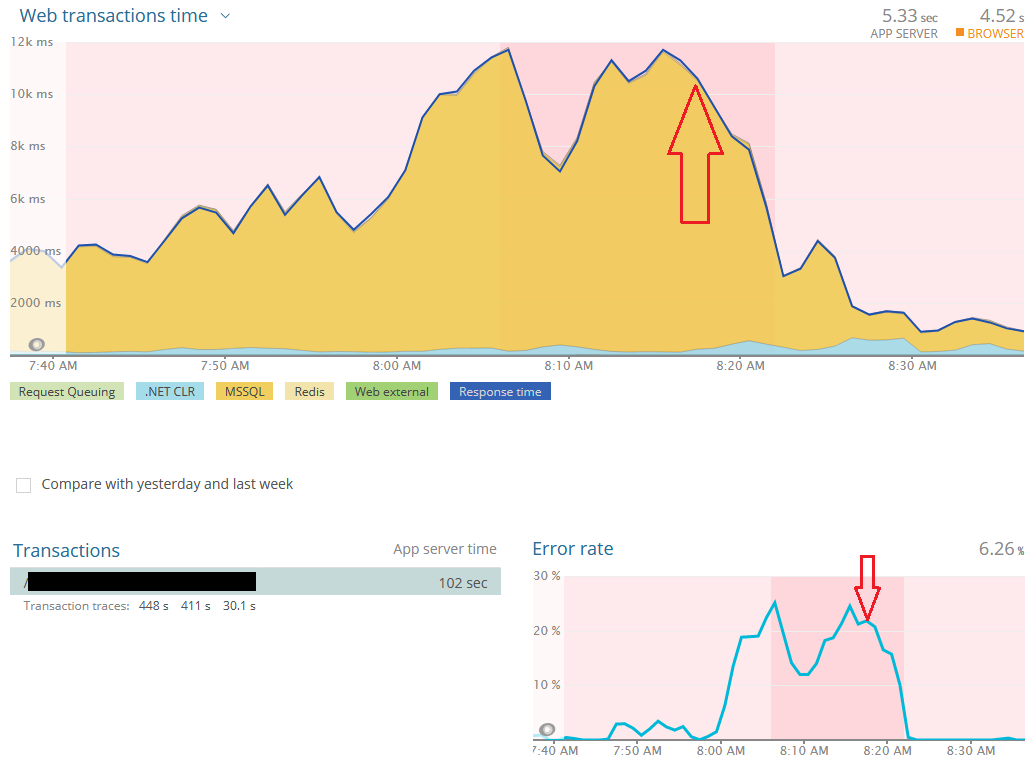
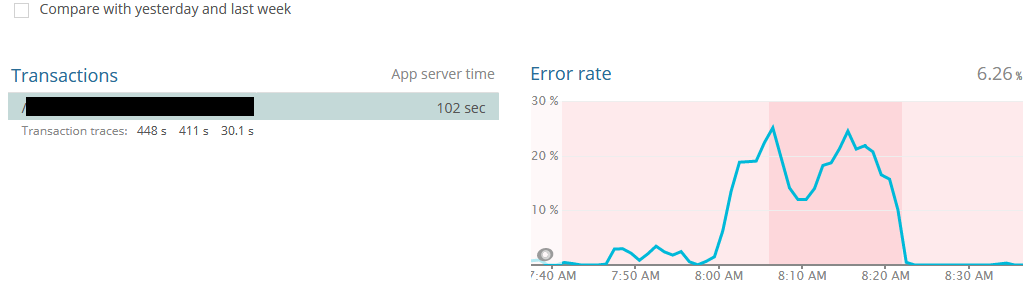
The red arrows indicate when the index was applied. Success!
That was a wild success. The SQL CPU dropped instantly. The web transactions eventually sped up once SQL churned through all the queued up transactions, and the error rate dropped back down to 0%.
If you’re looking for more insight on SQL performance investigation, I highly recommend Brent Ozar’s First Responder Kit: https://github.com/BrentOzarULTD/SQL-Server-First-Responder-Kit/tree/master
If you happen to be running on Azure’s SQL Managed Instance, you absolutely must read everything by Jovan Popavic. He’s saved my bacon on several occasions: https://medium.com/@jocapc
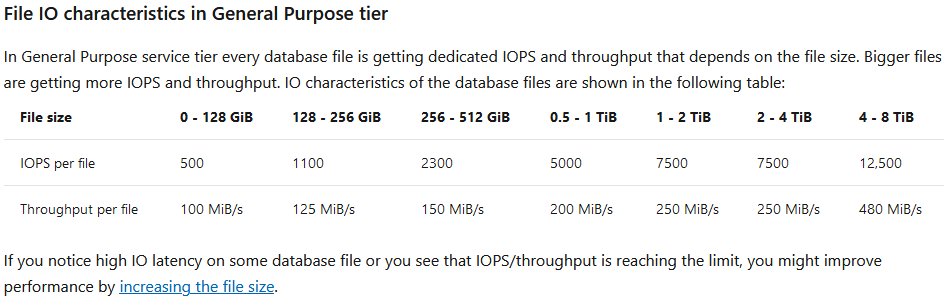
Did you know that General Purpose SQL MI data/log files are network-based (not stored on a local drive) and thus your network/file IO are based on the size of the data files? Jovan has scripts that help identify performance bottlenecks. Truly amazing stuff.